Data science has become one of the most sought-after skill sets in the modern workforce. Organizations across every industry collect massive amounts of data and need people who can turn that raw information into actionable insights. R, a language built specifically for statistical computing and graphics, remains one of the most powerful tools in a data scientist’s arsenal.
The tidyverse ecosystem — a collection of R packages designed around a consistent philosophy — has made R more accessible than ever, lowering the barrier for newcomers while maintaining the depth that experienced analysts need.
This second edition of R for Data Science arrives at a time when the demand for data-literate professionals continues to grow. Whether you are a student exploring the field, a researcher looking to level up your analysis skills, or a professional seeking to add data science to your toolkit, knowing how to import, clean, visualize, and model data is no longer optional — it is essential.
About the book
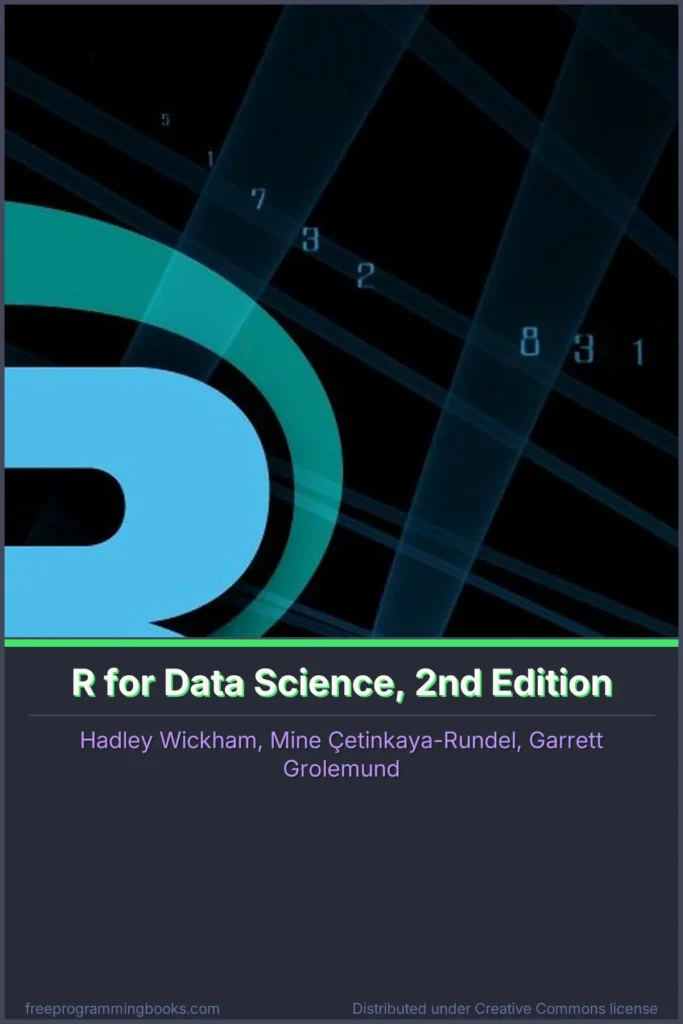
R for Data Science, 2nd Edition is a complete rewrite of the classic first edition, updated to reflect the latest best practices, packages, and tools in the R ecosystem.
Written by three authors deeply involved in the development of the tidyverse, this book takes a practical, hands-on approach to data science. You will learn by doing, starting with real datasets and working through the entire data science workflow.
The book assumes no prior programming experience. It begins with the fundamentals — getting R and RStudio set up, understanding the basic syntax, and writing your first lines of code — then builds up to advanced topics like working with databases, scraping data from websites, and building interactive reports with Quarto. Every chapter includes exercises that reinforce what you have just learned, making it suitable both for self-study and classroom use.
What you will learn
- Import data from flat files, spreadsheets, databases, and web APIs
- Tidy messy datasets into a consistent, analysis-ready format
- Create compelling visualizations with ggplot2
- Transform data using dplyr and the rest of the tidyverse
- Write reusable functions and automate repetitive tasks
- Work with strings, dates, and missing values effectively
- Build reproducible reports and presentations with Quarto
- Communicate results clearly with prose, code, and graphics
- Scrape data from websites and parse hierarchical formats like JSON
Table of contents
- Preface to the second edition
- Introduction
- Part I: Whole game — Data visualization, workflow basics
- Part II: Visualize — Data visualization with ggplot2, Layers, Exploring
- Part III: Transform — Data transformation, Numbers, Logical vectors, Missing values
- Part IV: Import — Data import, Spreadsheets, Databases, Big data, Rectangling, Web scraping
- Part V: Program — Functions, Vectors, Iteration, Base R
- Part VI: Communicate — Quarto, Presentations, Interactivity, Websites and books
Book details
- Title: R for Data Science, 2nd Edition
- Author(s): Hadley Wickham, Mine Cetinkaya-Rundel, Garrett Grolemund
- Publication year: 2023
- Publisher: O’Reilly Media
- Pages: 534
- PDF size: 29.89 MB
- Estimated reading time: ~13 h 21 min
- Level: Beginner
- Main category: Data Science
- Subcategory: Data Analysis
- Language: English
- License: CC BY-NC-ND 3.0 US
More books in: Data Analysis, Data Science
Legal notice: This book is shared for educational purposes only. The content is distributed under Creative Commons licenses or with explicit permission from the author. FreeProgrammingBooks may host files that comply with their respective licenses.